Tropical cyclones come in all shapes and sizes. Some are big, some are small. Some are strong, and some are weak. No two are exactly alike.
But what about the outliers?
The strongest winds
You can measure the strength of a tropical cyclone in a handful of ways. Maximum sustained winds are one way to measure intensity, like the Saffir-Simpson wind scale does.
Hurricane Patricia was the most intense storm ever recorded. Patricia developed in the northeast Pacific Ocean on Oct. 20, 2015. Maximum sustained winds peaked at 215 mph on Oct. 23, a global record that still stands today.
Satellite animation of Hurricane Patricia making landfall near Cuixmala, Mexico on Oct. 23. (NOAA)
Patricia weakened hours before making landfall. It moved through an area with higher wind shear during an eyewall replacement cycle, but still made landfall as a Category 4 storm with maximum winds of 150 mph.
It moved ashore in western Mexico near Cuixmala on Oct. 23.
In the Atlantic Basin, Hurricane Allen holds the record for maximum sustained winds, topping out at 190 mph. Allen formed on July 31, 1980 in the Atlantic Ocean and moved west, eventually passing through the Caribbean Sea into the Gulf.
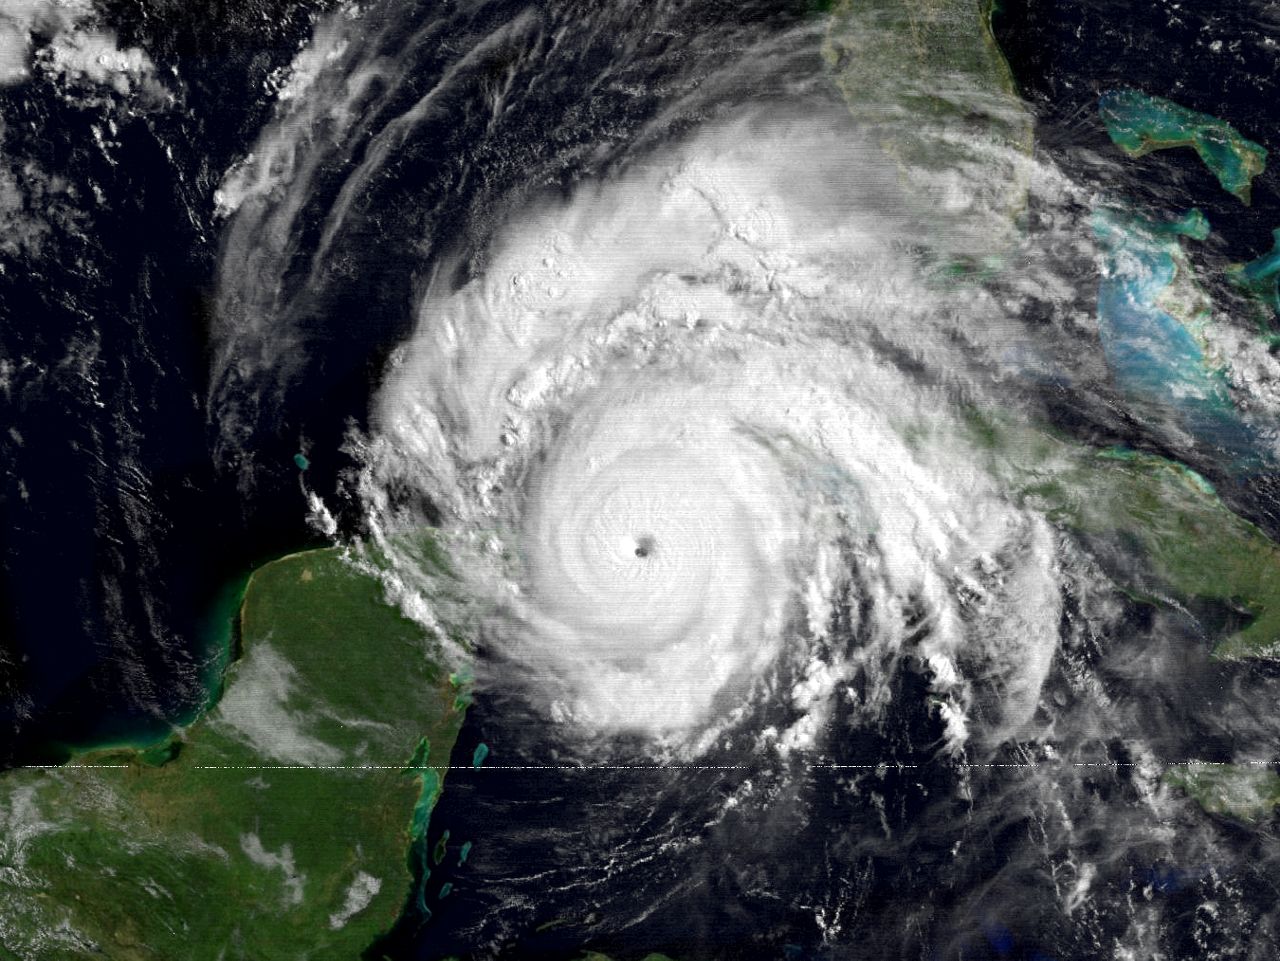
Satellite image of Hurricane Allen near peak intensity on Aug. 7, 1980. (NOAA)
It reached peak intensity as it passed between Cuba and the Yucatan Peninsula in Mexico. Allen eventually made landfall on Aug. 10 after weakening to a Category 3 storm on South Padre Island, Texas.
The biggest and most intense
Super Typhoon Tip deserves its own section of accolades. In 1979, it became the largest and most intense tropical cyclone ever recorded.
Minimum pressure is another way to measure a storm’s intensity. The lower the pressure, the stronger a storm. Tip’s minimum central pressure fell to 870 millibars (25.69 inches) at its peak, a record that still holds today.
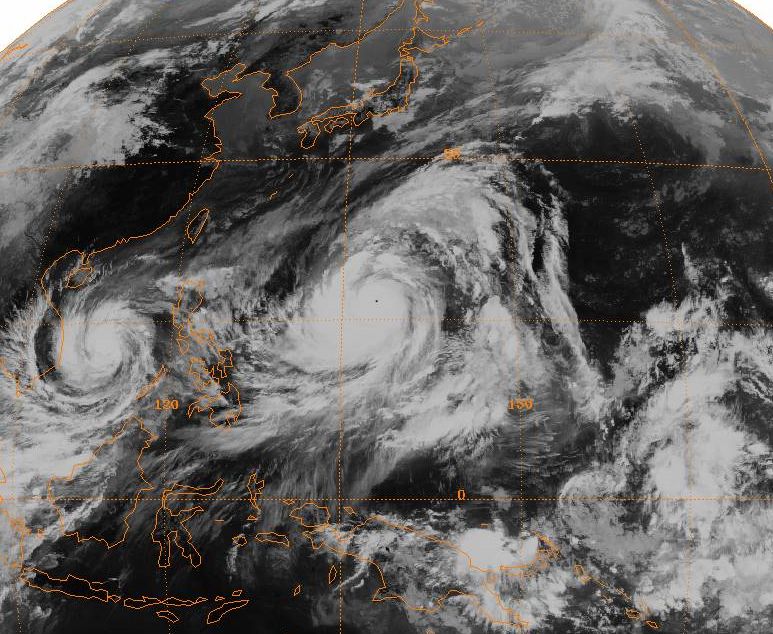
Satellite image of Typhoon Tip (center) near peak intensity, with Typhoon Sarah (left) near Vietnam. (NOAA)
It formed on Oct. 4, 1979, and strengthened in the western Pacific Ocean. After meandering in the open waters for a few days, it moved into a very favorable environment and rapidly strengthened between Oct. 9-11.
By the end of Tip’s rapid intensification, it was a monster storm with a diameter of 1,380 miles and maximum winds of 190 mph.
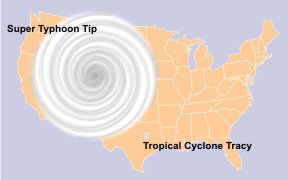
Size comparison between Typhoon Tip (largest tropical cyclone on record) and Cyclone Tracy (second-smallest tropical cyclone on record) imposed over the United States. (NOAA)
Tip eventually weakened before making landfall on the Japanese island of Honshu, with winds of 80 mph.
The smallest
Tropical Storm Marco was the smallest storm on record. It became a tropical storm in the Bay of Campeche on Oct. 6, 2008 and reached peak intensity the next day.
At its peak, maximum winds were 65 mph. Tropical storm-force winds extended only 11.5 miles from the center of the storm.
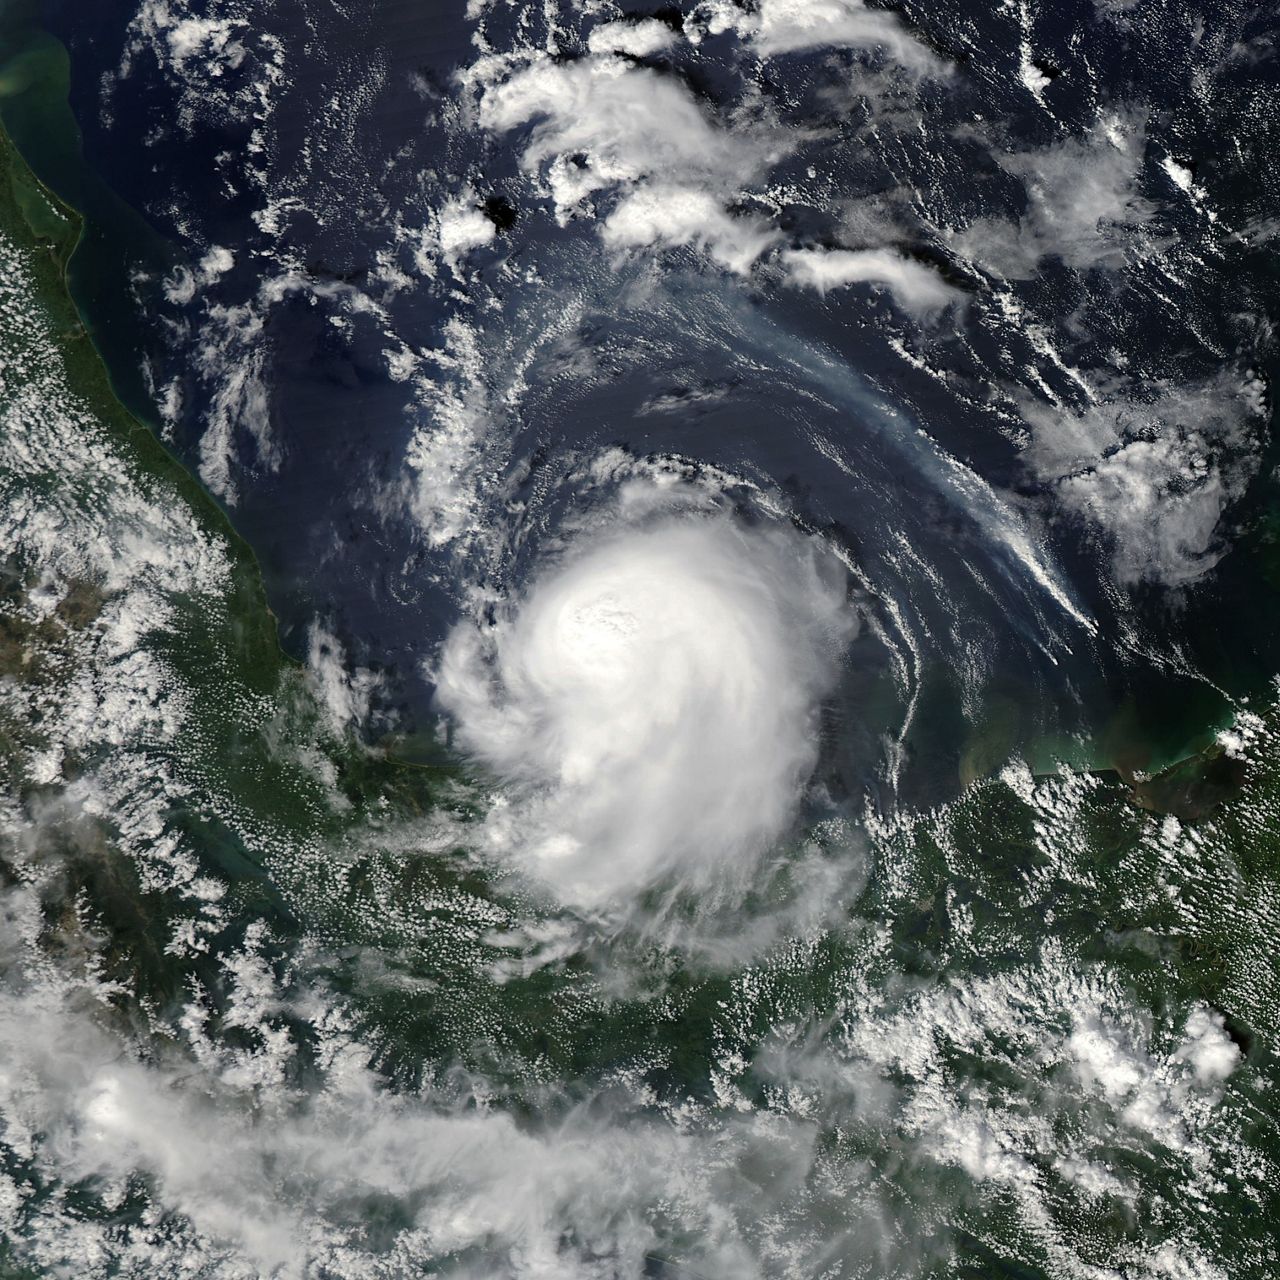
Tropical Storm Marco in the Bay of Campeche on Oct. 6, 2008. (NASA)
It made landfall in Mexico near Misantla, Mexico, causing minimal damage, but heavy rainfall and flooding.
Before Marco, Cyclone Tracy in 1974 in the southern Pacific was the smallest known storm (pictured above next to Tip). Tracy caused significant damage in Darwin in Australia, making landfall just after midnight on Christmas Day.
Unlike Marco, Tracy was a powerful storm, equivalent to a Category 3 on the Saffir-Simpson scale. It had wind gusts up to 135 mph and brought storm surge up to 13 feet in parts of Darwin.
The longest-lasting
Can you imagine a storm lasting more than a month? Cyclone Freddy lasted five weeks and two days in the southern Indian Ocean. Freddy formed earlier this year on Feb. 5, 2023 between Indonesia and Australia.
After forming, Freddy trekked west across the entire southern Indian Ocean with many ups and downs in intensity. On Feb. 21, Freddy made its first landfall near Mananjary, Madagascar.
Freddy emerged into the Mozambique Channel, eventually making its second landfall on Feb. 24 south of Vilankulos, Mozambique.
Freddy weakened after making landfall, but it wasn’t done just yet. Days later, Freddy’s remnants moved back over water in the Mozambique Channel.
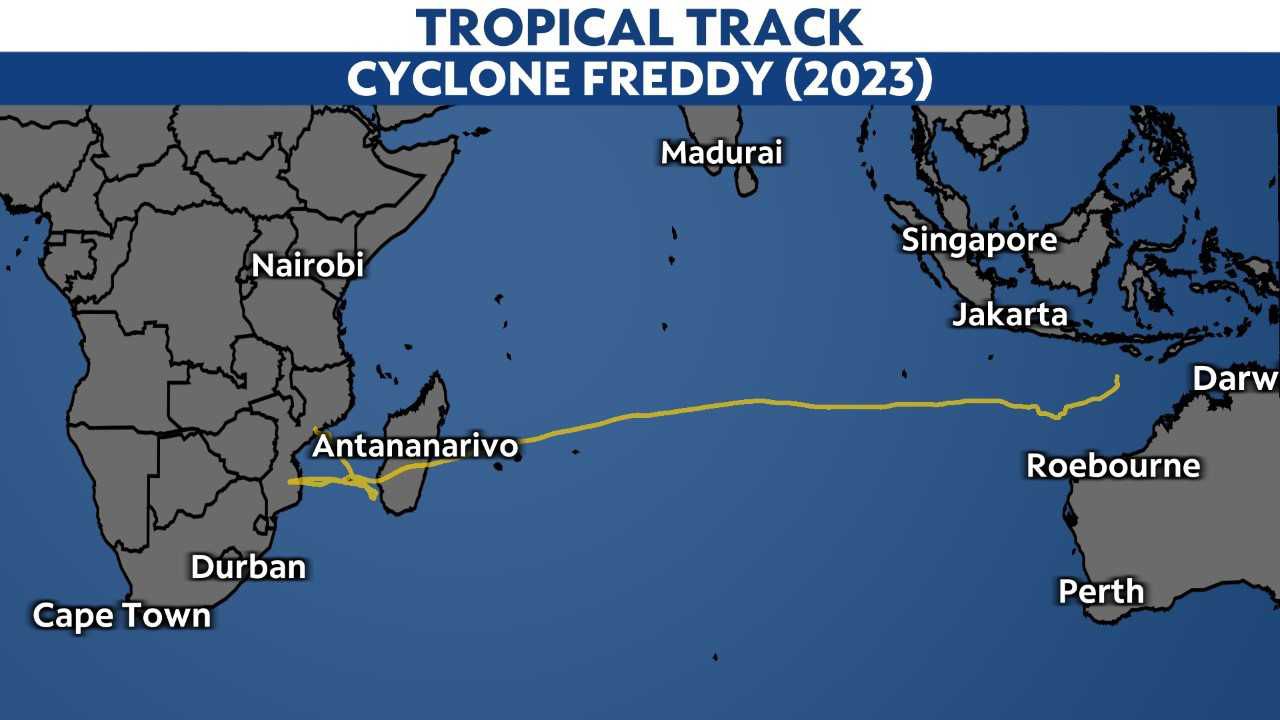
Freddy continued to fluctuate in intensity over water as it approached the west coast of Madagascar. Instead of making another landfall in Madagascar, it turned west again.
Freddy made its third and final landfall in Quelimane, Mozambique, on March 11, dissipating three days later on March 14.
Not only was Freddy the longest-lasting tropical cyclone ever, but it holds the worldwide record for the highest accumulated cyclone energy (ACE).
It’s one of only four tropical cyclones to move across the entire southern Indian Ocean from east to west, and the first tropical cyclone to undergo rapid intensification seven different times.
The wettest
Cyclone Hyacinthe was the wettest tropical cyclone ever. Hyacinthe formed in the southern Indian Ocean back on Jan. 15, 1980. It became the wettest storm on record without making a single landfall.
It isn’t notable for its intensity or strength, but instead, a combination of its looping track, forward speed and geographic factors.
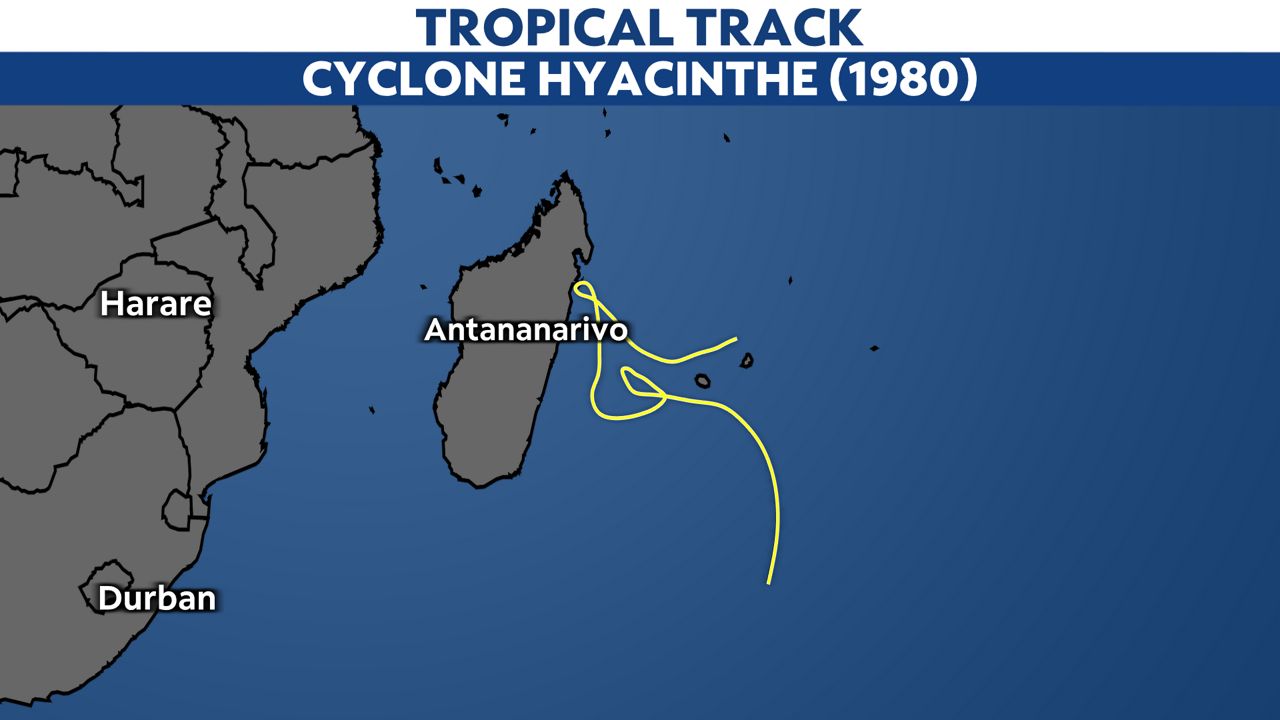
Hyacinthe formed east of Madagascar, near the small islands of Mauritius and Réunion. During Hyacinthe’s lifespan, it made three close brushes by Réunion, a French colony and small island in the Indian Ocean.
More than a foot of rain fell across nearly the entire island over just a 12-day period. Commerson Crater, a volcano caldera, saw the most rainfall. Between Jan. 14-28, 1980, 239.5 inches of rain fell. That’s almost 20 feet of rainfall.
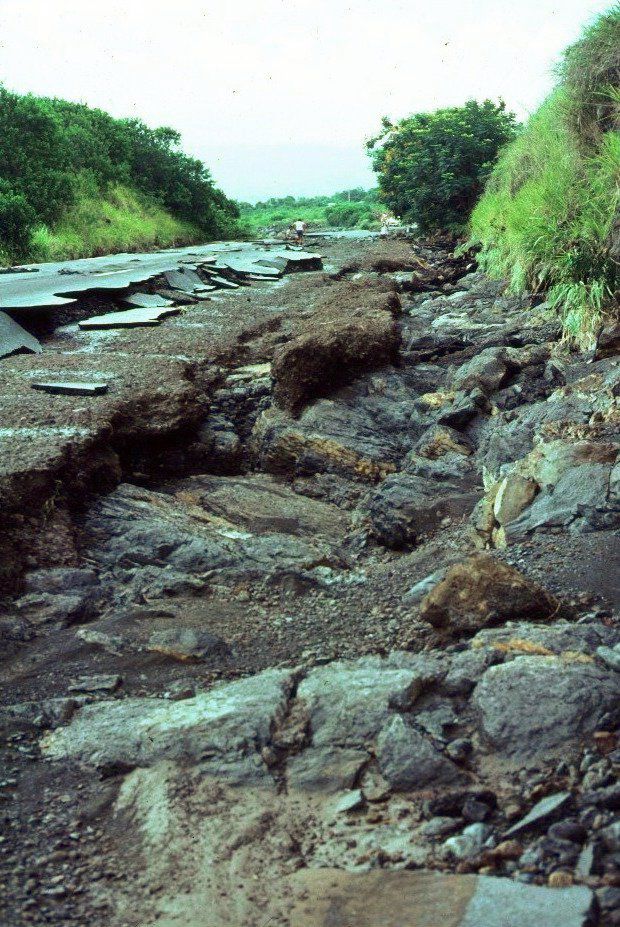
Destruction after a landslide in Réunion after the first passage of Hyacinthe. (Jean-Claude Hanon/CC BY-SA 3.0)
Since Réunion is a mountainous island, the extreme rainfall totals were enhanced by orographic lift. Orographic lift is a process in which mountains force wind to move upward. As the air lifts, it cools and condenses, forming rain if enough moisture is available.
The torrential rainfall led to hundred of landslides on the island, along with heavy damage to roads, homes and crops.
The costliest
The costliest storms ever are a couple of familiar names: Hurricane Katrina and Hurricane Harvey. Both Gulf Coast storms are estimated to be responsible for up to $125 billion in damages.
Katrina’s first landfall on Aug. 25, 2005, was in South Florida as a Category 1 hurricane…. although Katrina isn’t remembered for that.
Three days later, Katrina was a Category 5 hurricane in the Gulf of Mexico after rapidly intensifying over abnormally warm waters. At the time, it was the strongest hurricane ever recorded in the Gulf of Mexico.
Katrina made its second landfall near Buras-Triumph, La. on Aug. 29 as a Category 3 hurricane, and its third landfall near the Louisiana/Mississippi border.
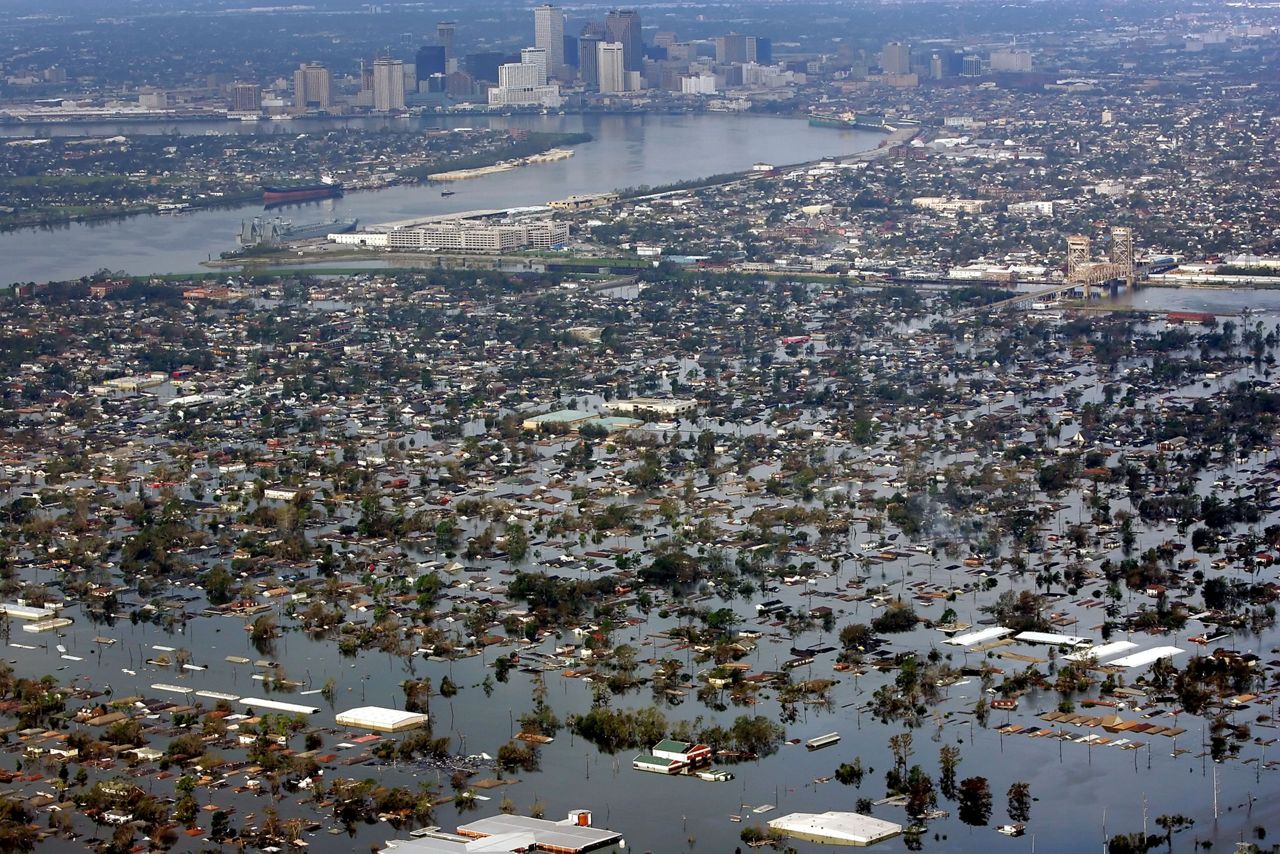
Floodwaters from Hurricane Katrina cover a portion of New Orleans in this Tuesday, Aug. 30, 2005 photo, a day after Katrina passed through the city. (AP Photo/David J. Phillip)
Even as a major hurricane, it wasn’t just the winds that made Katrina so costly. The massive storm surge caused 53 levee breaches around New Orleans, leading to significant flooding around the city that sits below sea level.
You can read more about Hurricane Katrina here.
Hurricane Harvey was the other storm responsible for up to $125 billion in damages. Harvey made landfall near Rockport, Texas on Aug. 26, 2017 as a Category 4 hurricane.
It ended a nearly 12-year major hurricane landfall drought in the U.S., the first since Wilma in 2005. Harvey’s wrath, though, was mostly from epic rainfall and incredible flooding around southeast Texas.
After making landfall, Harvey weakened and stalled inland. As it slowly drifted back toward the Gulf, it dumped heavy rainfall over parts of Texas, especially around Houston.
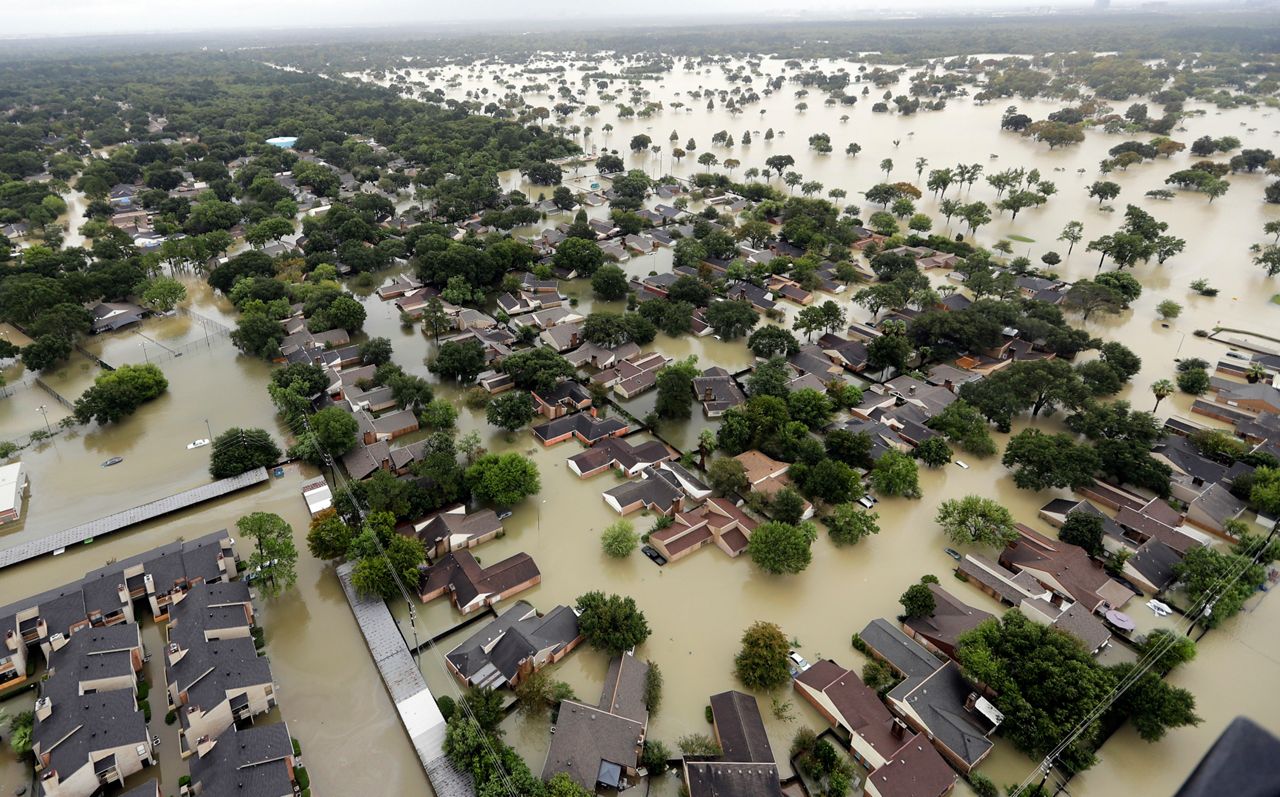
In this Tuesday, Aug. 29, 2017, photo, water from Addicks Reservoir flows into neighborhoods as floodwaters from Tropical Storm Harvey rise in Houston. (AP Photo/David J. Phillip)
At least 30 inches of rain fell around the Houston metro area during Harvey. The peak rainfall total came in Nederland, Texas, where 60.58 inches of rain fell. Harvey also holds the record for the wettest tropical cyclone in the United States.
Read more about Hurricane Harvey here.
Our team of meteorologists dive deep into the science of weather and break down timely weather data and information. To view more weather and climate stories, check out our weather blogs section.