Whether you’re familiar with them or not, we’ve all seen data from weather models. You see them in temperatures or rain chances on a weather app, or a rain or snow forecast from your favorite meteorologist on Spectrum News.
Different weather models all have their owns strengths and weaknesses, but serve one purpose. To predict the future accurately.
The advancement and evolution of weather models came at the same time as computers. As computing power increased and weather observations and satellite data became more available, it quickly spurred to life a new era of weather forecasting.
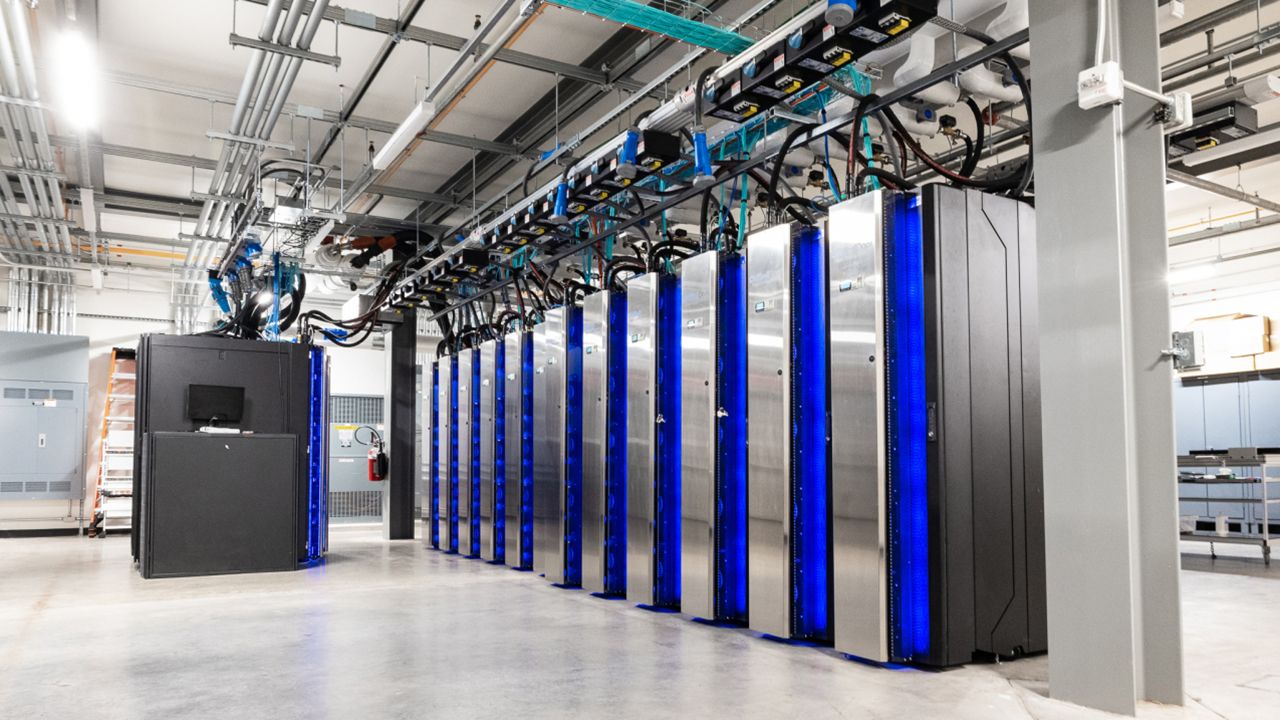
Twin supercomputers Dogwood (pictured here) and Cactus are the newest additions to NOAA’s weather and climate operational supercomputing system. (General Dynamics Information Technology)
In 2022, NOAA introduced two new supercomputers that are in the top 50 fastest computers in the world. The two new supercomputers will allow NOAA to use higher-resolution models that capture small-scale features like thunderstorms better and perform more models simulations to increase certainty.
How models work
Weather models all use the same base set of mathematical equations, known as the primitive equations, based on dynamics and physics that simulate how wind, temperature and moisture evolve within the atmosphere.
Today’s supercomputers can use those equations, combined with weather observations and satellites, to create a forecast.
Since we don’t have weather stations everywhere across the planet, especially over water, there are lots of gaps in data. That is where satellite data helps to fill in the gaps.
Above the surface, weather balloons are vital in collecting data in the upper levels of the atmosphere. Twice daily, the National Weather Service (NWS) forecasters release weather balloons from almost 900 locations worldwide. This includes 92 balloons released by the NWS in the U.S. and its territories.
Weather balloons can climb up to 10,000 feet, or 20 miles above the surface, collecting data the entire way up. All the data collected from weather balloons (temperature, pressure, humidity, winds, etc.) is input into computer models to improve forecasts.
Along with weather balloons, Hurricane Hunter operations are crucial in collecting upper air data in and around hurricanes and developing tropical systems, and even winter storms.
The models
There isn’t a “one size fits all” method for forecasting the weather. Models play a large role, but there’s more to it than just picking a model and blindly following the guidance.
There is an extensive list of models to choose from, and it’s important to know the strengths, weaknesses and purpose of each one before using them.
The most popular, or well-known models in the U.S. are the American Global Forecast System (GFS) model and the European Centre for Medium-Range Weather Forecast (ECMWF) model, or more commonly just known as the “Euro.”
The GFS and the Euro are both global forecast models that predict weather for the entire world four times a day, and the forecasts extend from 10 to 16 days in the future. There are a handful of other global weather models, but these are the most common in the U.S.
Along with the single runs GFS and Euro, there is also ensemble forecasting. Global models can run up to 50 forecasts across the entire globe at once, each with a different set of initial conditions, which can help determine uncertainty in a forecast.
If 45 out of 50 model runs in an ensemble forecast rain, there is pretty high certainty that it will rain. However, if only half show rain and the other half are dry, the forecast is more uncertain.
Ensembles are popular during hurricane season, and forecasters use “spaghetti models” or “spaghetti plots” to help visualize the different tracks of the storm from different models.
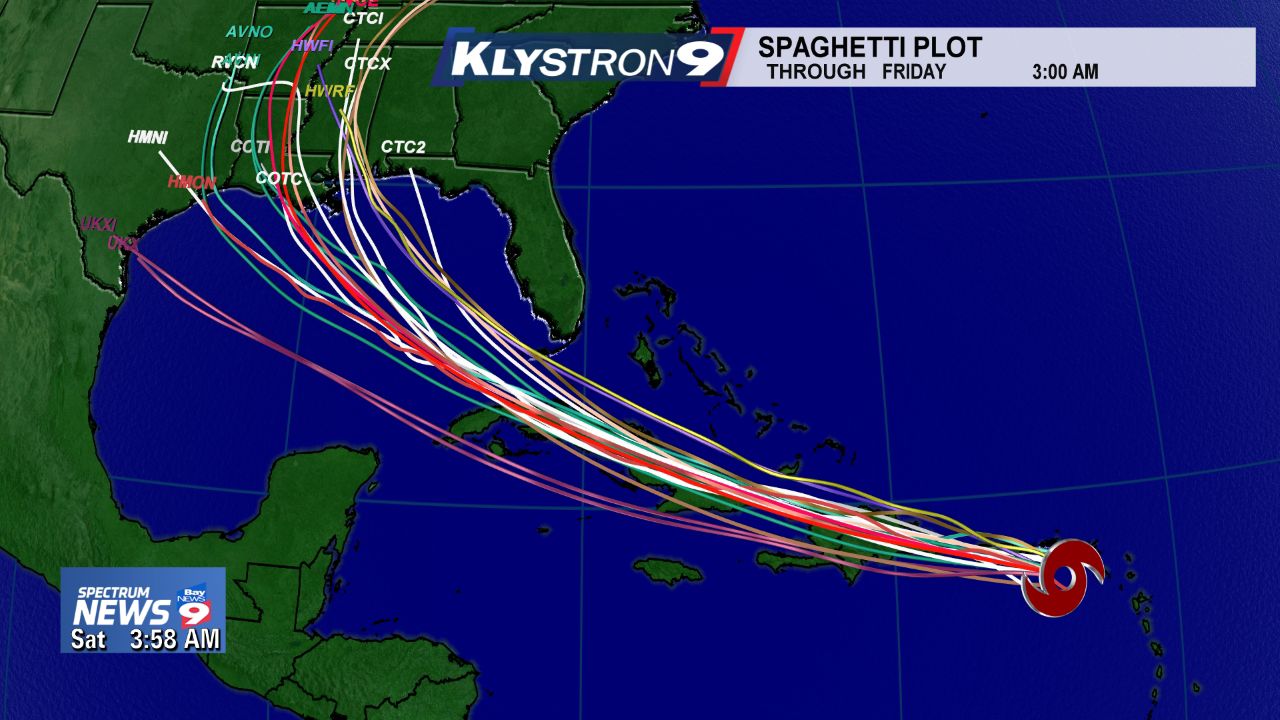
Spaghetti plot of Tropical Storm Laura in 2020.
We create spaghetti plots with global and hurricane models. During hurricane season, there are hurricane specific models (HMON, HWRF, SLOSH) that run for tropical cyclone forecasts.
Forecasters couple these models with models that specialize in hurricane track, intensity, rainfall and surge forecasts, and they can compare those with other global model forecasts on the same map.
On the other hand, there are short-term, high-resolution models like the High-Resolution Rapid Refresh (HRRR) model and the North American Mesoscale Forecast System (NAM) that specialize in forecasting the weather for smaller areas, but with better details.
The HRRR and the NAM only forecast for the contiguous United States. With the smaller area, they can run more times per day (up to once per hour) and at a better resolution than the global models.
This allows for better short-term forecasts with more updates per day, especially leading up to severe weather events. The smaller grid allows for more precision, identifying features like thunderstorms with more detail.
As far as weather models have come, there are still limitations, whether it’s because of a lack of data, geographical features like mountains or population centers that contribute to urban heating.
The best forecasts still heavily rely on models, but hand-in-hand with the expertise of a human knowing the strengths and weakness of each model, and the ability to express uncertainty and communicate a forecast in the best way.
Our team of meteorologists dive deep into the science of weather and break down timely weather data and information. To view more weather and climate stories, check out our weather blogs section.